Without doubt, the COVID-19 pandemic has caused a great deal of societal and economic unrest across the globe. In response to this, the emotional thermometer of society has risen and jeopardized our sense of security and peace of mind. Many investors look at the events occurring within the economy as indicative of market performance, but it is important to understand how economic activity and the stock market are correlated in order to safeguard against emotional investment decisions that can disrupt the steady long-term path of pre-pandemic investment strategies.
Between February 19th and March 23rd, we observed a ~34% drop in the S&P 500, the fastest downswing in US market history. Having hit a low at 2,237 late March, the S&P 500 has rallied 40% through June 4th despite the unemployment rate reaching 14.7% in April, which Economists forecast rose as high as 19.8% in May. Update: on Friday June 5, 2020 they announced a decline in unemployment to 13.3% in May.
You might wonder, how could this be? In order to answer that we first need to assess the correlation between economic activity and S&P 500, or “market” performance.
The stock “market” as most people define it is the S&P 500 – a list of 500 of the largest businesses that an investor can take an ownership stake in via liquid exchange. These businesses offer tangible products and services that consumers purchase, use and benefit from, despite what is happening within our society and economic landscape. The nature of these businesses evolves as society evolves, thus the nature of the stock market changes as businesses evolve to meet changes in consumer demand.
As we read about rising unemployment rates and the largest government stimulus packages in history being released, what is being observed are macro changes in economic activity, which undoubtedly affect the S&P 500 businesses but not necessarily in direct correlation. In order to understand how businesses are tangibly affected by economic activity and how you as an investor can remain agile without derailing your long-term planning strategy, we must consider:
- The composition of S&P 500 businesses
- The dividend yield of the S&P 500 vs. other alternatives now and historically
- Common investor biases and how they limit decision making
Understanding the S&P 500 Index History and Composition
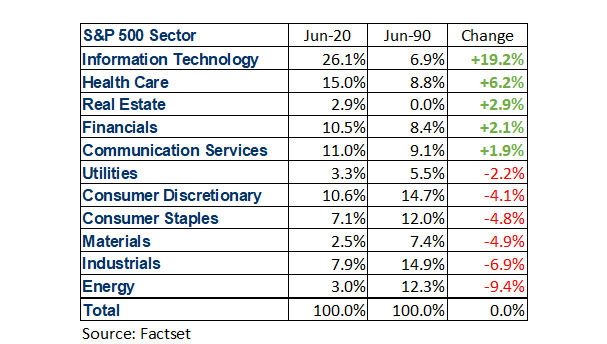
In an effort to understand how the S&P 500 index may be affected by world events and economic fluctuations, it is worth looking at the actual industries and businesses that currently make up the market. As illustrated in the chart below, what once were the dominating industries within the market 30 years ago have experienced some of the greatest decline. Materials (-4.9%), Industrials (-6.9%), and Energy (-9.4%) now comprise only ~13% of the overall stock market. These industries are highly dependent on cyclical fluctuations and are labor and capital intensive, which make them more susceptible to changes in the social and economic environment.
In contract, the 2 largest increases in industry composition over the last 30 years have been in Technology (+19.2%) and HealthCare (+6.2%). Today, these two sectors comprise ~41% of the S&P 500 market.
The data shows that the current S&P 500 market is comprised of more businesses that are poised to weather the current economic environment than suffer from it – by a 3:1 weighted ratio!
With that in mind we then have to consider how well poised these industries are to weather economic fluctuations and assess how the stock market” may react to those fluctuations. As we have seen, the HealthCare industry has been put under tremendous pressure to respond to the COVID-19 pandemic, and rapidly find solutions to protect against future outbreaks. Similarly, the technology industry is experiencing upturn as businesses and consumers take to working from home, rely more heavily on delivery services and find new ways to connect socially while respecting social distancing protocols.

By breaking down the conceptual nature of the stock market to consider the tangible nature of its individual parts, the data indicates that S&P 500 businesses are actually in a strong position to deliver investor returns; and as Aristotle reminds us about strength in numbers, “the whole is even stronger than the sum of its individual parts”.
Put another way, the data shows that the current S&P 500 market is comprised of more businesses that are poised to weather the current economic environment than suffer from it – by a 3:1 weighted ratio!
Investor Emotions – Short Term vs Long Term Investment Decision Making
This infamous saying begs the question, “is it better to have a fixed amount of the known today or more of the potential unknown tomorrow?”
Think of buying/selling an ownership stake in an S&P 500 business in contrast to selling your house – if you wanted to sell your house, you would reasonably expect it to take months to find the right buyer, complete the paperwork and close the deal. However, if you wanted to sell your ownership stake in a business, let’s say Apple, you could do so any weekday between 9:30AM-4PM EST.
Because it is within every investor’s grasp to buy/sell equities when the urge presents itself, it is much more difficult to safeguard the stock market against emotional, or reactive investment decisions.
For the true long-term investor typically speaking, the best solution is to avoid getting caught up in emotional reactivity and to keep your eye on the bigger picture. Unfortunately, it happens all too often that investors get discouraged by environmental fluctuations and are quick to reflect their emotions in their investment decisions, as though the two must rise and fall in correlation.
But this is not necessarily true! The value of a business is based on the expected future cash flows over a prolonged period of time, and therefore does not really change on a day-day, month-month or even year-year basis. It is generally people’s emotions that drive fluctuations!
Is the bird in hand really worth two in the bush?
Looking into the immediate past as an example, between February 19th – March 23rd the herd of consumer emotions led to a wave of short-term focused investment decisions. Opting for the bird in hand, flocks of investors sold their stake in public businesses and bought into Treasury bonds or liquidated their assets to cash for safe harboring.
Whether you stayed the course or fled the stock market during that time, it is important to remember that today’s S&P 500 businesses are far less susceptible to changes in economic activity than they have been historically. So for the longer-term investor with the patience to stay the course, herein lies an opportunity to opt for the two birds in the bush!
Should I move my money out of the stock market?
Given how the economy “feels” and the assumptive correlation many investors make between the economy and the stock market, when environmental destabilization occurs people tend to look for alternative places to invest their money.
Let us compare the S&P 500 to Treasuries. Based on a given belief that the US Government will not default on their debt, Treasury bonds can be considered essentially risk-free, making them the safest asset to purchase. The current 10-year yield (or income you will receive for lending your hard-earned money to the US Government) is 0.74%. So, if you lent the government $1M for 10 years, you would receive $7,400 per year, and your $1M back in year 10, for a total return of $74,000.
In comparison, the current dividend yield (or, the cash returned to shareholders divided by the price you pay for your share of the business) of the S&P 500 is 1.9%. So, if you bought $1M of the S&P 500 today, you would receive $19,000 per year, with potential for your dividend and original investment to actually appreciate with greater accumulation over the same 10-year time frame!
It is also important to note that the ratio between the dividend yield on the S&P 500 and that of a 10-year Treasury is actually much greater than it has been historically (as illustrated by the chart below). This means that owning businesses vs. lending money is much more attractive than it has been historically.
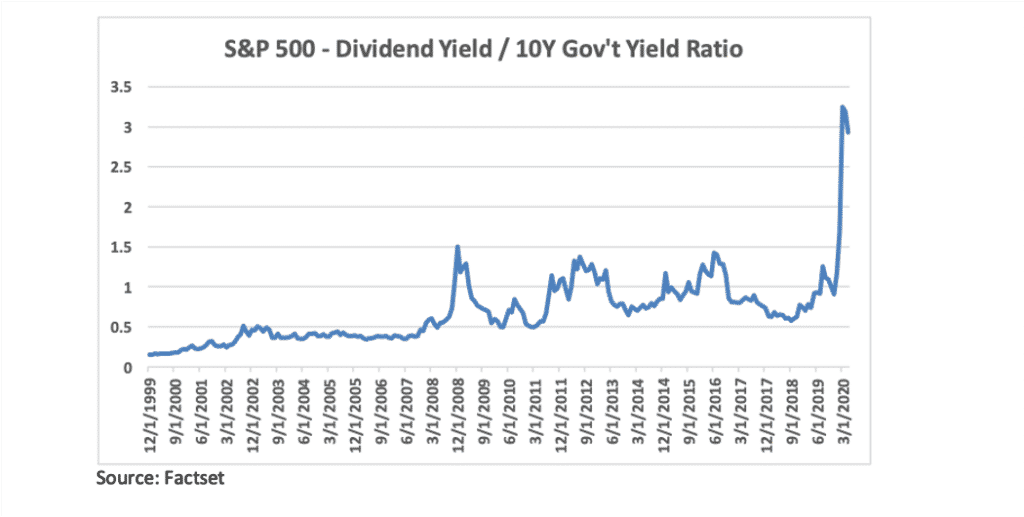
Even more impressively, the dividend yield / 10Y government bond ratio is further pronounced in the developed non-US world where the dividend yield on the MSCI EAFE (non-US proxy) is 3.4%, while Japan has a 0% yield and Europe currently has a negative government bond yield.
Key Investor Takeaways
Many investors look at the events occurring within the economy as indicative of market performance, but it is important to understand how economic activity and the market are correlated in order to safeguard against emotional investment decisions that can disrupt the steady long-term path of pre-pandemic investment strategies.
Whether you stayed the course or fled the market in the first Quarter of this year, it is important to remember that today’s S&P 500 businesses are far less susceptible to changes in economic activity than they have been in the past. For the longer-term investor with the patience to stay the course, herein lies an opportunity to opt for the two birds in the bush!
Hopefully this article has helped you gain a deeper understanding of the relationship between social and economic activities, and “the market” as well as the importance of looking at the individual strengths of the businesses that make up the S&P 500 in your effort to anticipate market performance during times of environmental instability.
The power of mindset is critical in remaining focused on your long-term financial goals. No matter your knowledge or experience level as an investor, having a financial coach in your corner is critically important to help you align your aspirations and goals with your investment strategy, and to provide the behavioral coaching necessary to remain informed and level-headed! Even the best stars have always had a partner: Jordan needed Pippen and Phil Jackson, Lebron James needed Dwayne Wade and Chris Bosh, and even Mario needed Luigi!
At SAM our dedicated team of professionals consider it our fiduciary duty to provide clients with the highest standard of care and service in the advisory world. To learn more about how we may help you, get in touch with a member of our team today.